MARKETING ANALYTICS
Measuring
paid social & search
campaign performance (e-commerce)
Paid media campaign performance analysis across 200 campaigns over three years, comparing different campaign strategies at the overall, regional, and audience levels.
SQL · Tableau
Overall Performance
Regional Performance
Audience Performance
200
Campaigns
3
Years
4
Paid Channels
12UK
Regional Performance
KPIs
Industry Benchmarks
THE BRIEF
Unifying paid social & search campaign results
The team can track and analyse all paid social & search campaign results in order to optimise their upcoming campaigns
Problem
Separate reporting for paid social and paid search campaigns across different channels makes it difficult to monitor and evaluate performance consistently. As a result, it is challenging to assess overall campaign performance, analyse results by region and audience segment, and determine whether each campaign has achieved its KPIs.
Objective
- Consolidating campaigns data and results data
- Modelled and normalised data tables to improve report performance.
- Developing a unified interactive dashboard that tells the story behind
each campaign
- Set industry benchmarks as target KPIs for the first year and established annual performance targets for subsequent years.
THE DELIVERABLE
Dashboard Stages
1- Overal Performance
- Campaign detail
- performance against KPIs (overall industry benchmarks)
- Daily performance of campaign
- Impression, click, & conversion funnel
2- Regional Performance
- Number of conversions in UK regions
- Regional distribution of conversions
- Generated revenue per campaign
3- Target Audience
- Demographic detail, purchase device & interests of
target audience who made purchases
HOW IT WAS BUILT
01
Model the data
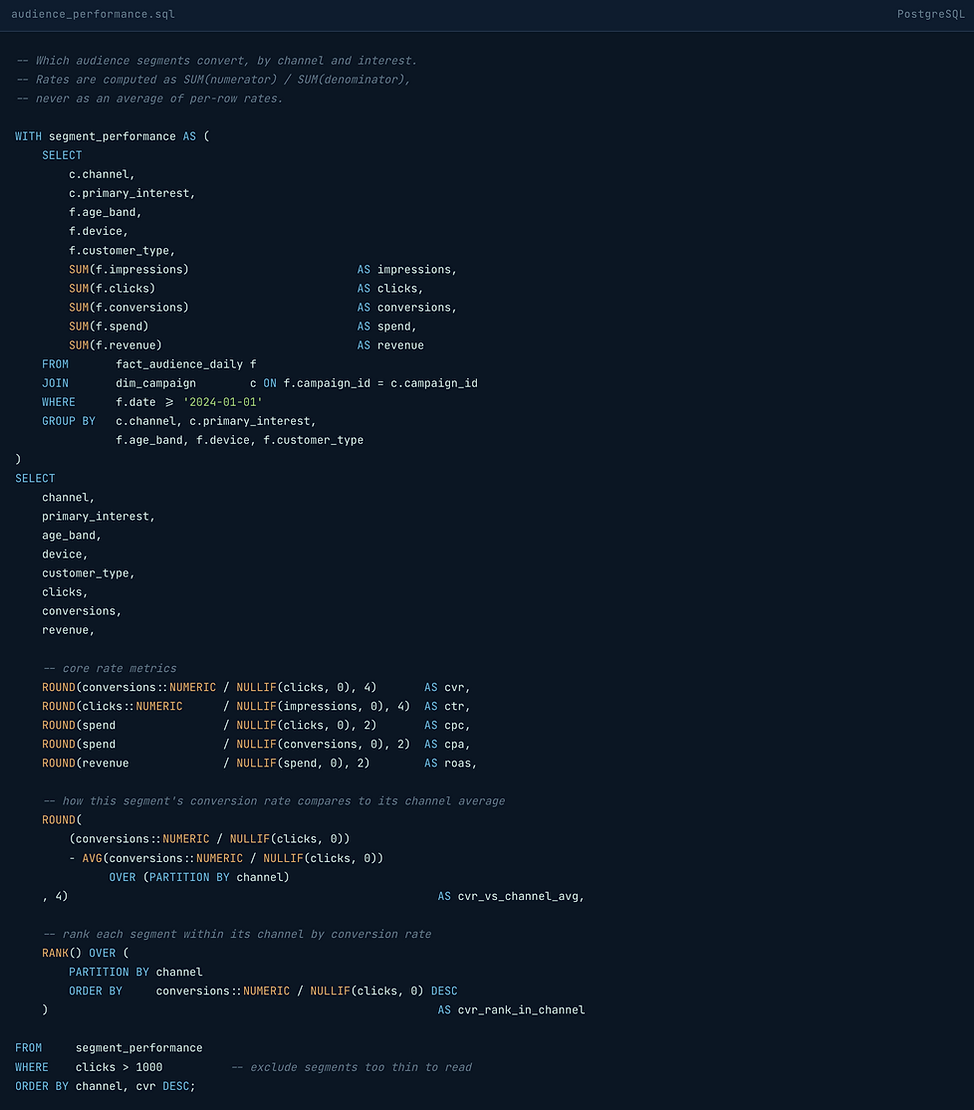
Campaigns data gathered, aggregated, and joined through SQL.
02
Dashboard Design
3 Main stages including overall performance, regional performance, and audience performance
03
Visualise & slice
Tableau on one source, every chart cross-filters by date, channel, region, audience and variant.

THE AGGREGATION LAYER
SQL behind the metrics
Performing aggregations and joins in order to retrieve
each campaign performance