
CAMPAIGN MEASUREMENT
Measuring marketing performance:
integrated A/B & lift test dashboard
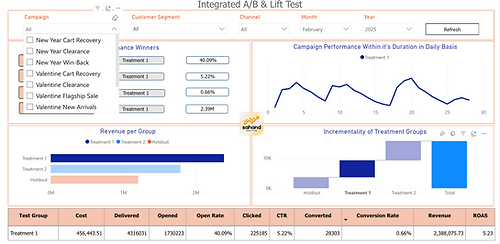
An interactive Power BI dashboard uniting campaign performance and test results across segments and channels, revealing not just whether a campaign worked, but which strategy, creative, or copy performed best.
Power BI
DAX
Lift / Holdout
Incrementality
A/B Testing
3
Channels
KPIs
Track KPI Winners
+60
Campaigns
THE BRIEF
Unifying paid social & search campaign results
The team can track and analyse all paid social & search campaign results in order to optimise their upcoming campaigns
Problem
Campaign results and test data were scattered across cluttered files and reports, making it difficult to analyse marketing performance alongside experiment outcomes in one place.
Objective
Develop an interactive, easy-to-navigate Power BI dashboard that brings campaign performance and test results together across customer segments and marketing channels, enabling the team to assess whether each campaign succeeded and, if so, which strategy performed best.
THE DELIVERABLE
Dashboard Overview
Navigation Bar
All campaign performance and results are easily navigable through slicers.
Winners for the key metrics
Key update instantly by test group as the channel, segment, or campaign selection changes.
Daily Performance
A daily trend line chart shows each group's performance across the campaign period.
Incrementality
Incremental conversions and revenue for the test groups against the holdout are clearly identifiable.
Summary of Results
A summary of each strategy versus BAU (holdout) supports deeper and more detailed exploration.

TEST METHODS
Two complementary experiments
A/B TEST
Which creative, strategy, or copy won
Campaign results and test data were scattered across cluttered files and reports, making it difficult to analyse marketing performance alongside experiment outcomes in one place.