CUSTOMER ANALYTICS
From data to strategy:
RFM customer segmentation
Segmenting customers by recency, frequency, and monetary value to profile each group's behaviour and channel preferences, enabling precise and data-driven marketing.
RFM Scoring
10 Segments
Behavioural profiling
Analytics Dashboard
SQL · Tableau
THE BRIEF
Unpacking the customers behavioural story behind raw sales data
Problem
The marketing team lacked a clear understanding of customer behaviour, preferences, and lifecycle stage, making it difficult to optimise communications, select the right channels, and launch effectively targeted campaigns.
Objective
- Segment customers based on recency, frequency, and monetary value
- Profile each segment's behavioural and channel preferences
- identify high-value and at-risk groups for prioritisation
- enable precise, data-driven marketing decisions
METHOD USED
R
Recency
How recently a customer last purchased or engaged. E.g. time since last order.
F
Frequency
How often a customer transacts. E.g. total number of orders or average time between visits.
M
Monetary
How much a customer spends. E.g. total or average transaction value.
THE DELIVERABLE
Dashboard Stages
01
Segment Size
A tree map for demonstrating segment size
3 heat maps for each segment average spending, shopping on promotion, and satisfaction rate
02
Behavioural pattern
Clustered horizontal bar chart for the purpose of demonstrating VIP and casual members
A horizontal bar chart for visualising number of purchase by each segment
03
Preferences & Behavioural Analysis
Percentage of preferences and other behavioural factors segments by pie charts
HOW IT WAS BUILT
Summary of Key Insights
01
Potential Loyalists are the largest segment (28.7% of the base) and hold 43% of all VIP members, strong potential to convert into Loyal Customers and Champions.
02
At Risk customers (16.9%) are the 4th most valuable segment, averaging £325 spend, yet are slipping away, a high-priority target for urgent retention
03
Cannot Lose Them (4.6%) are the 2nd-highest spenders at £414 average with a purchase frequency of 10, but inactive for an extended period, requiring immediate reactivation.
04
New Customers and Promising segments show the lowest purchase variety (2 categories each) and highest discount reliance (63% and 45%), category spread can be widened through targeted offers and cross-sell.

THE AGGREGATION LAYER
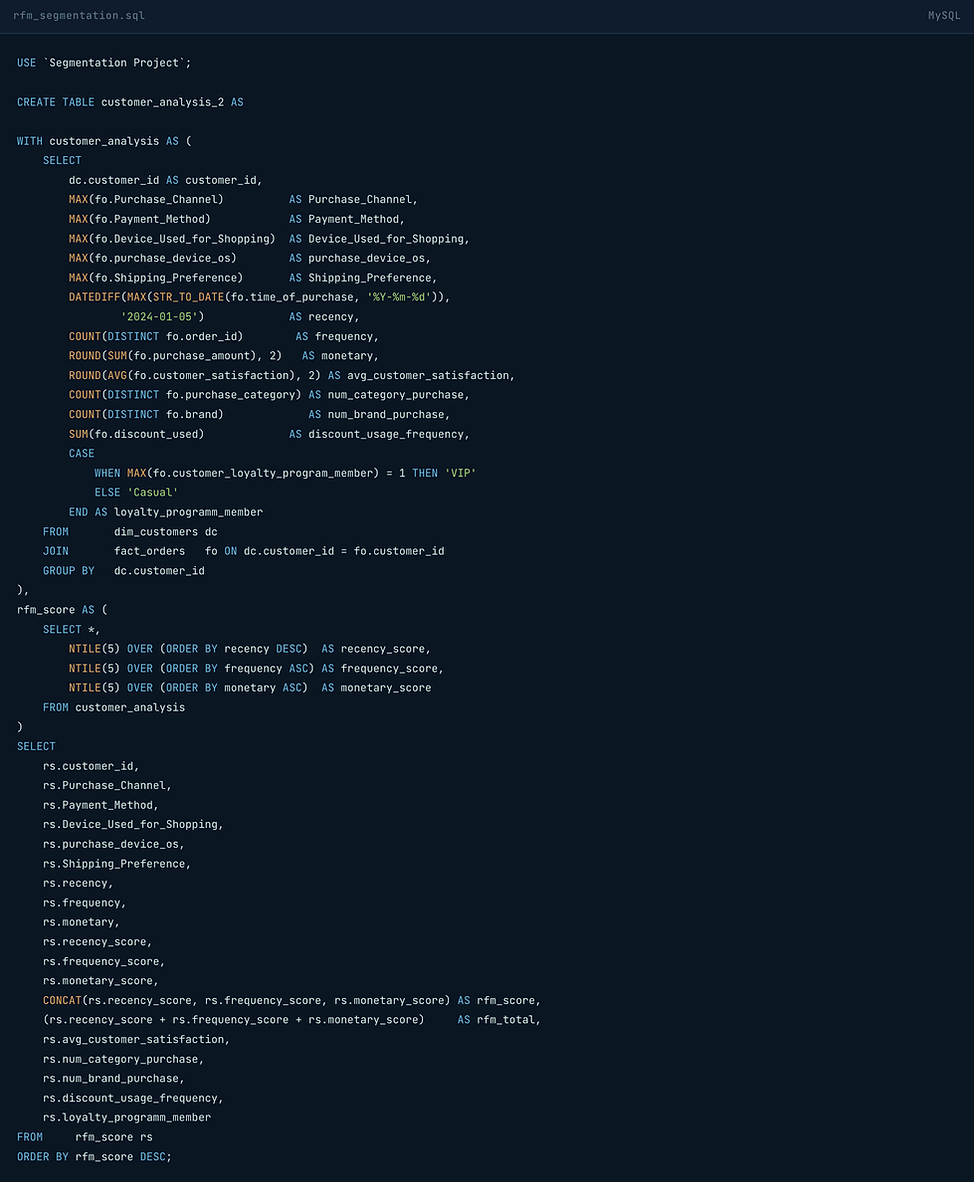
SQL behind the metrics
Performing aggregations and joins in order to retrieve
scores and other detailed data customer by customer